(2022 Canadian Survey on Disability, Statistics Canada)
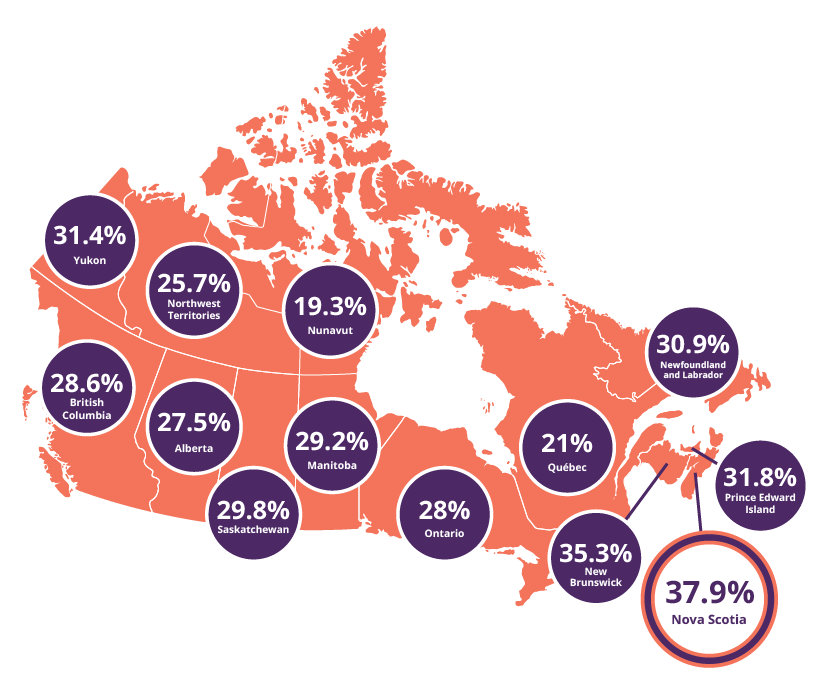
There are 8 million Canadians aged 15 and older living with one or more disabilities. Nova Scotia continues to have the highest rate of disability in the country, at 37.9% compared to 27%.
For the most recent data, visit the Statistics Canada Accessibility Statistics Hub
Accessibility and Disability Fact Sheets
These fact sheets provide information from Nova Scotians with disabilities on their experiences with barriers, discrimination, and employment supports. They also provide information on Nova Scotians' views on disability, awareness that accessibility is a human right, and awareness of barriers to accessibility.
2022 Canadian Survey on Disability - Nova Scotia Results

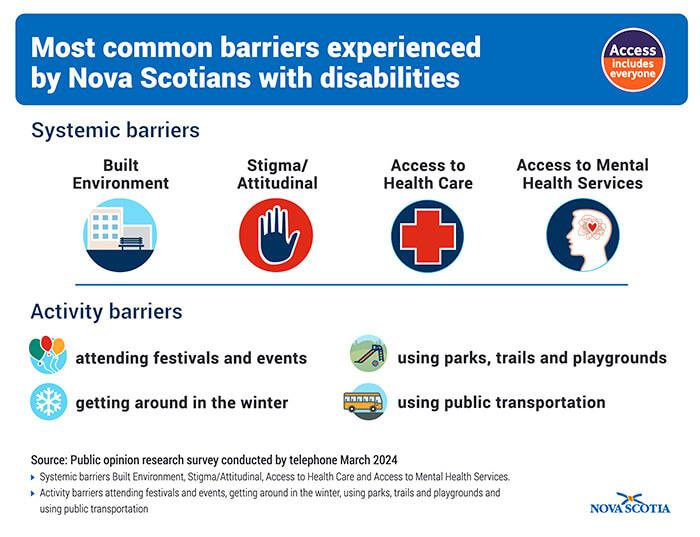
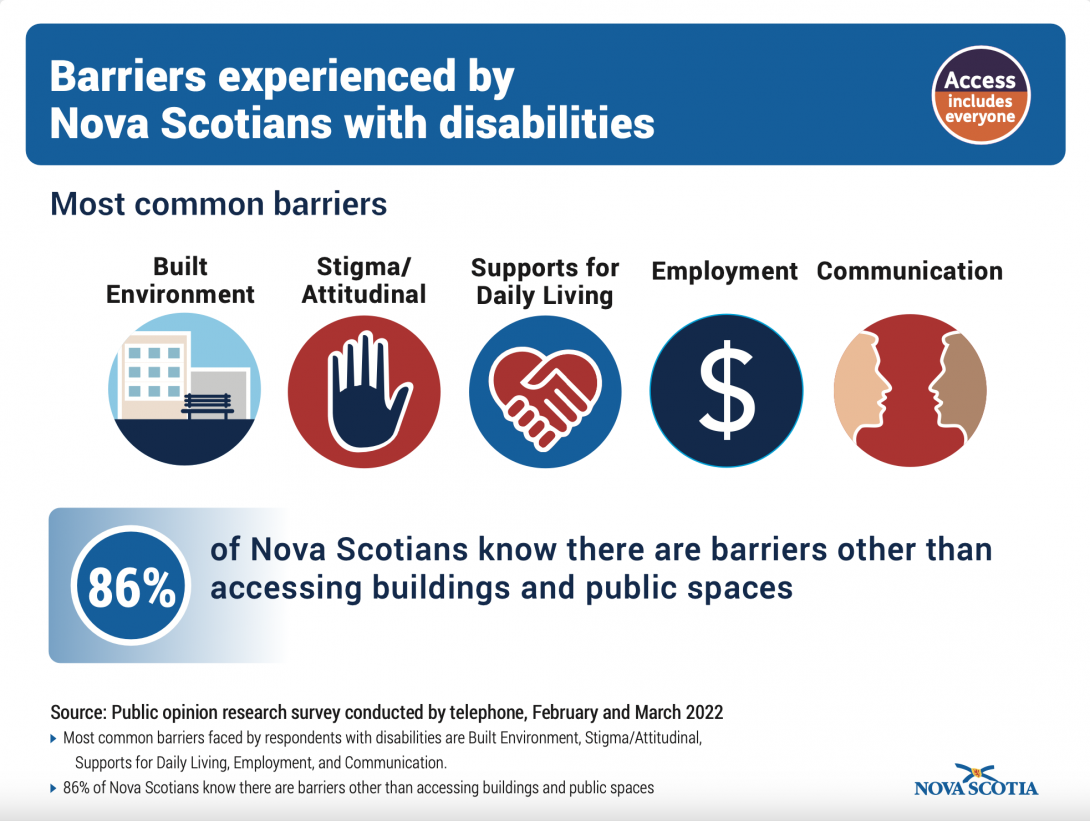
Barriers experienced by Nova Scotians with disabilities 2024
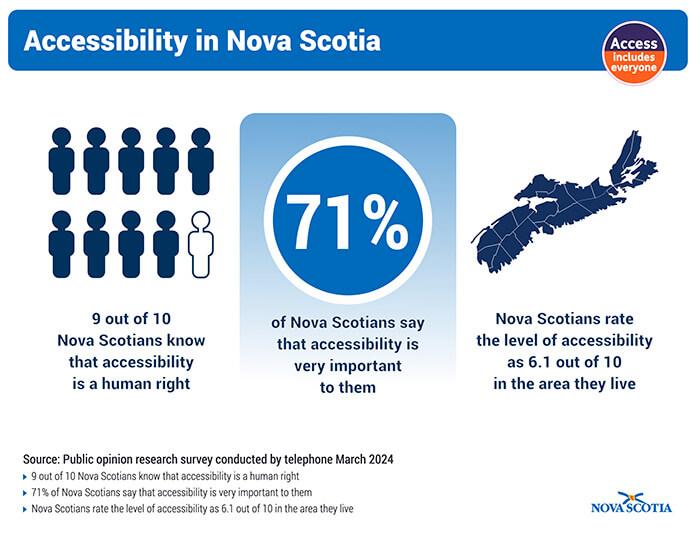
Accessibility is important to Nova Scotians 2024
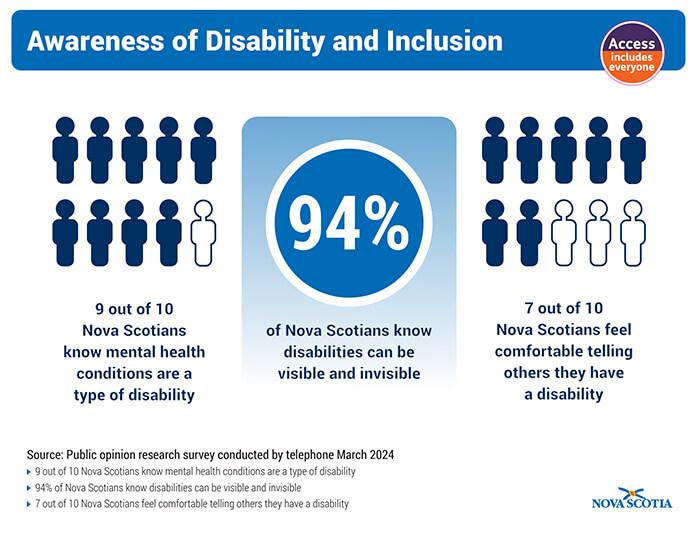
Awareness of Disability and Inclusion 2024
Barriers experienced by Nova Scotians with disabilities 2022
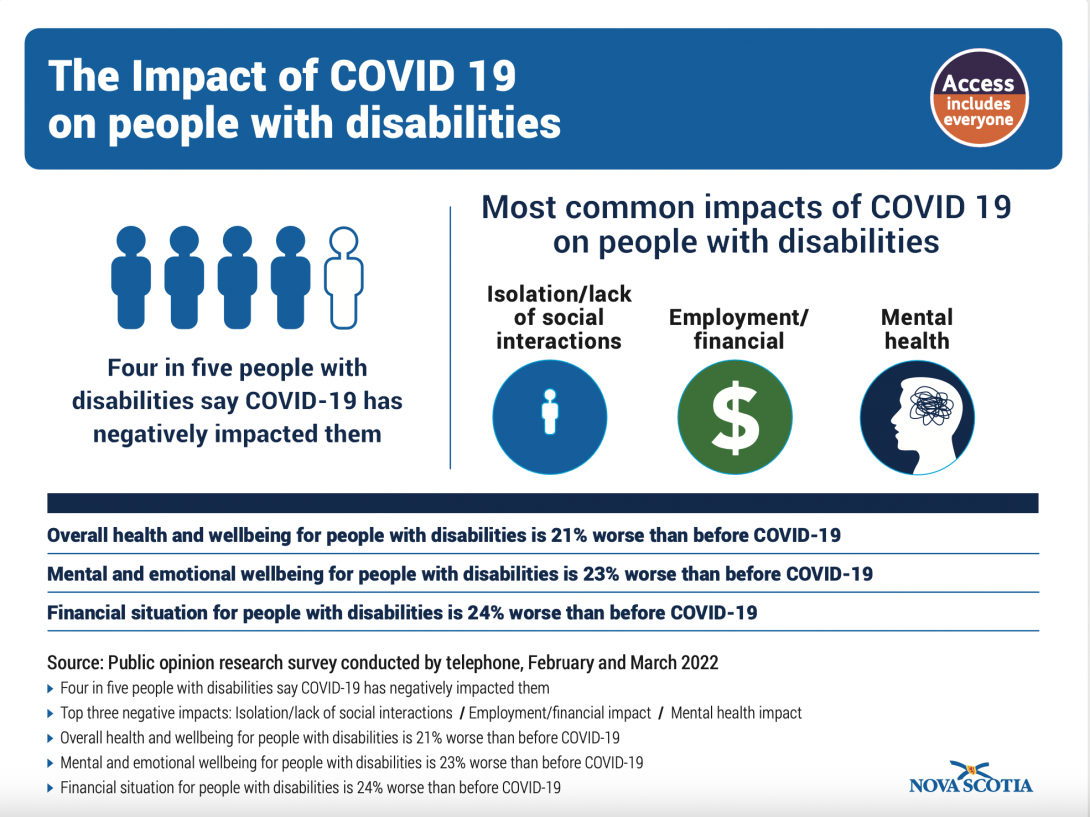
Impact of Covid 19 on people with disabilities 2022
Types of disabilities
While over half (64.5%) of reported disabilities in Nova Scotia are related to pain or mobility-related conditions, this only tells half the story.
Disabilities can be visible or invisible. They can be constant or periodic and can change in severity or experience over time. People can also have multiple disabilities at one time.
Disability Type by Rate, 2022
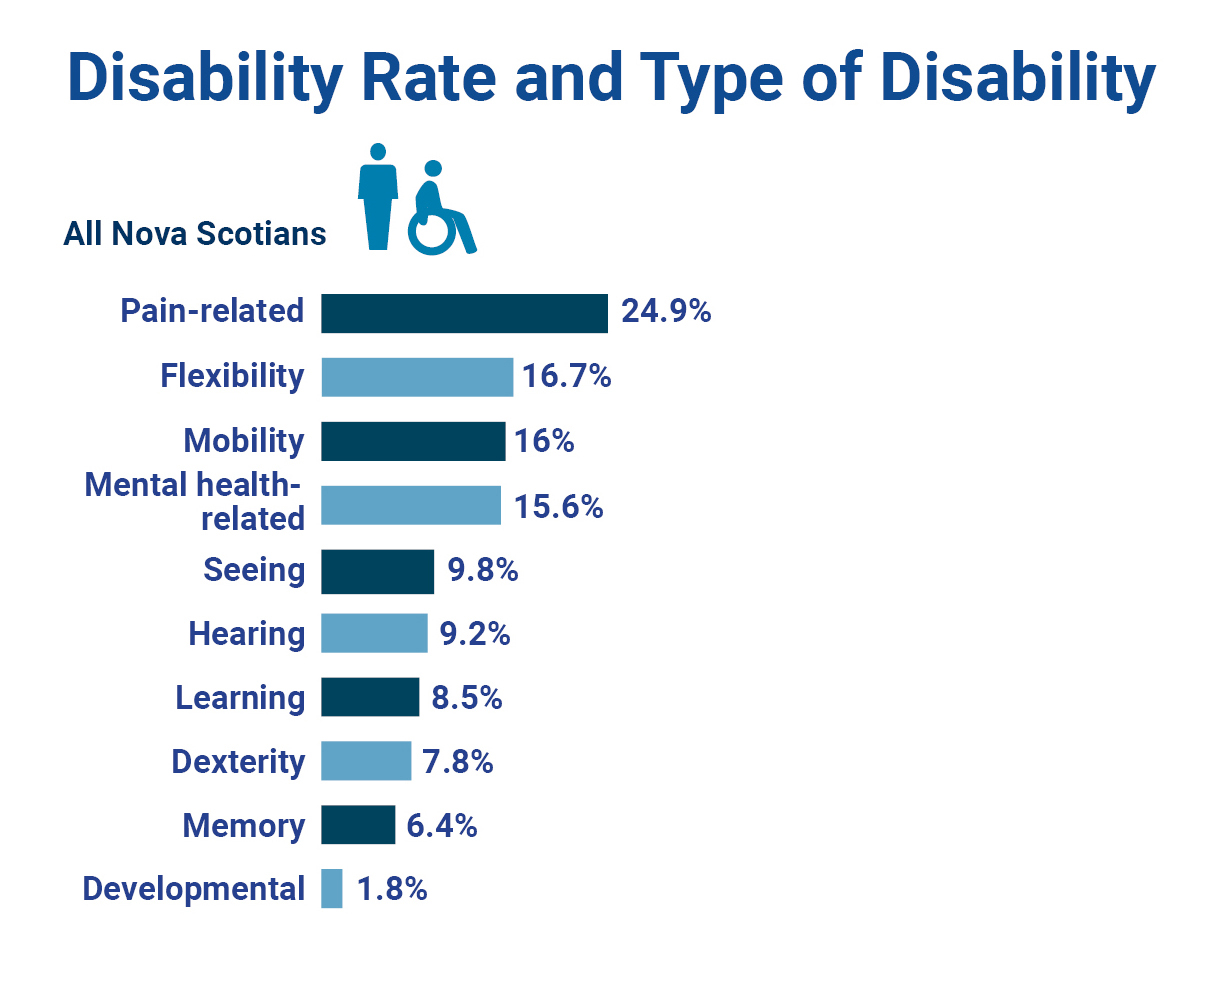
Over half (65.4%) of reported disabilities in Nova Scotia are related to pain or mobility-related conditions (pain related, flexibility, mobility, and dexterity). Other common types of disabilities include hearing, seeing, memory, learning or mental health related.
Disabilities can be visible or invisible. That means you may not always know when someone has a disability. Disabilities can be constant or periodic and can change in severity or experience over time. People can also have multiple disabilities at one time.
Aging with and aging into disability
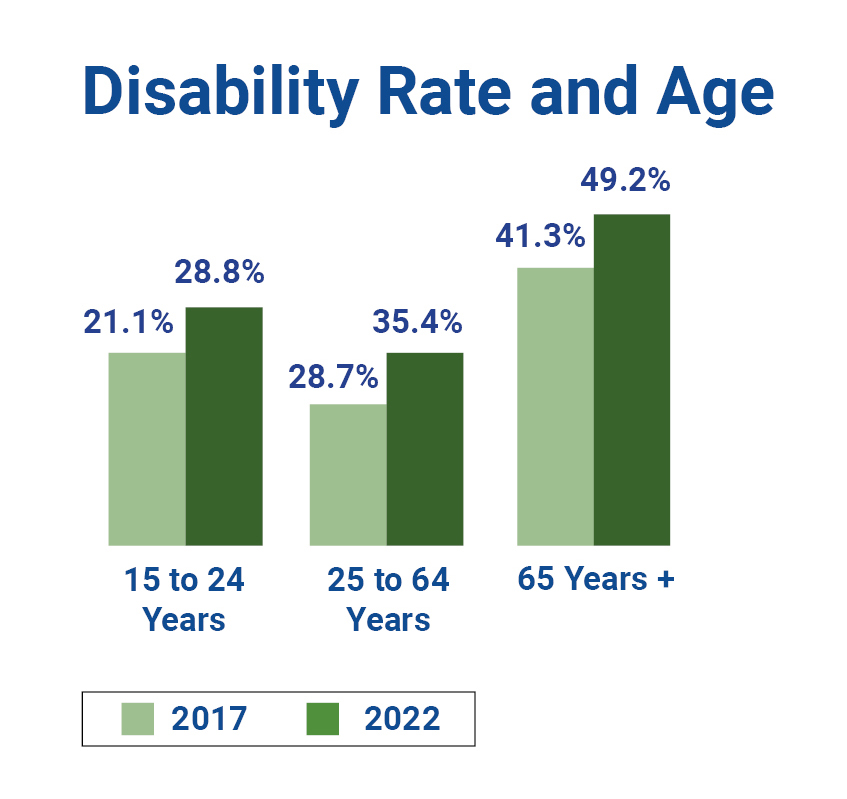
49.2% of Nova Scotians 65 years and older have reported having at least one disability, showing that many people can develop new disabilities as they grow older. There is further evidence to suggest that as the population ages, people with disabilities are likely to experience increased severity of their disabilities as well.
This is important as Nova Scotia has one of the highest aging populations in Canada. And this increases the potential impact on access to their everyday lives and highlights the need for proactive accessibility initiatives to prevent barriers to full social and economic inclusion.
Labour force participation
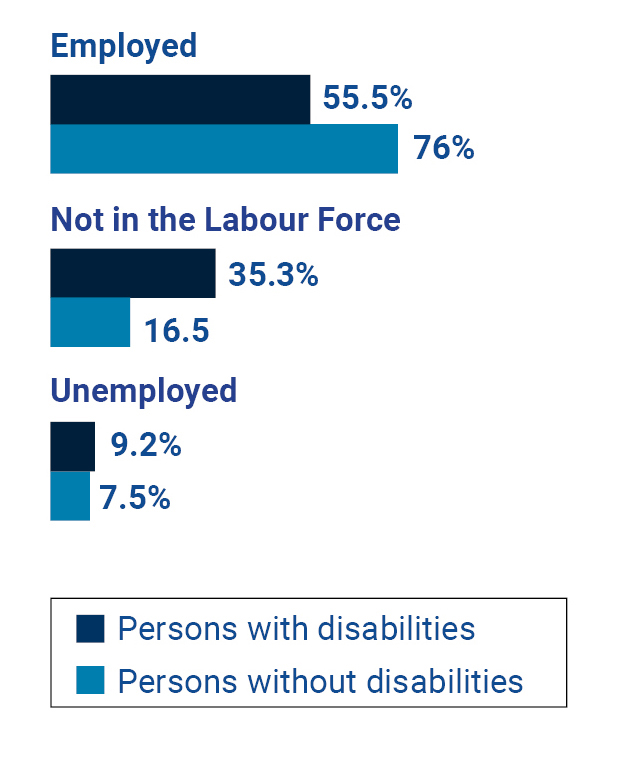
Many people with disabilities face barriers to obtaining, maintaining, and advancing in meaningful employment. Preventing and removing these barriers can help increase participation of people with disabilities in the labour force.
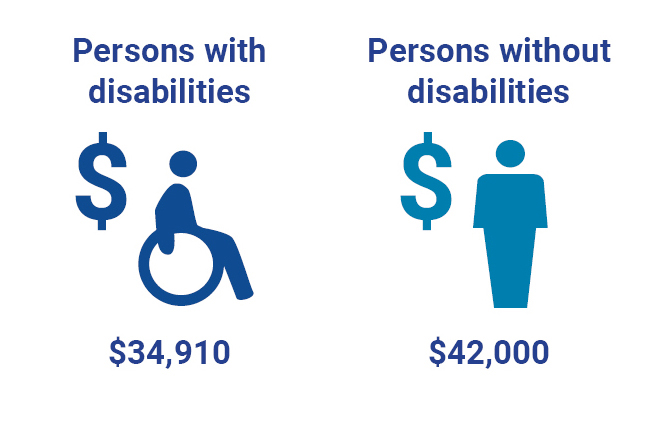
Nova Scotians with disabilities tend to have lower incomes than those without disabilities. The median annual after-tax income for persons without disabilities is $42,000. The median annual after-tax income for persons with disabilities is $34,910. The data shows that persons with disabilities earn less income than people without disabilities. Nova Scotians with very severe disabilities earn approximately $17,000 less than people without disabilities.
Impact of COVID-19
Canadians with disabilities have been disproportionately affected by the COVID-19 pandemic. Many people with disabilities are at high risk for getting COVID-19 and facing complications.
A Statistics Canada survey from 2020 found that the pandemic made it harder for Canadians with disabilities to meet their day-to-day needs like food, healthcare and support services.
Before the pandemic, Canadians with disabilities were more likely to experience social isolation. They earned less money and were more likely to be employed. The pandemic increased all of these effects for Canadians with disabilities.
Learn more: Impacts of COVID-19 on persons with disabilities (Statistics Canada)